Climate Change and Mysterious NOAA Data
Years ago I compiled data from seven differing weather stations across the United States and compared them against temperature predictions by NOAA itself claiming disasters temperature rise in the next forty years. Here is the image with the predictions and observations.
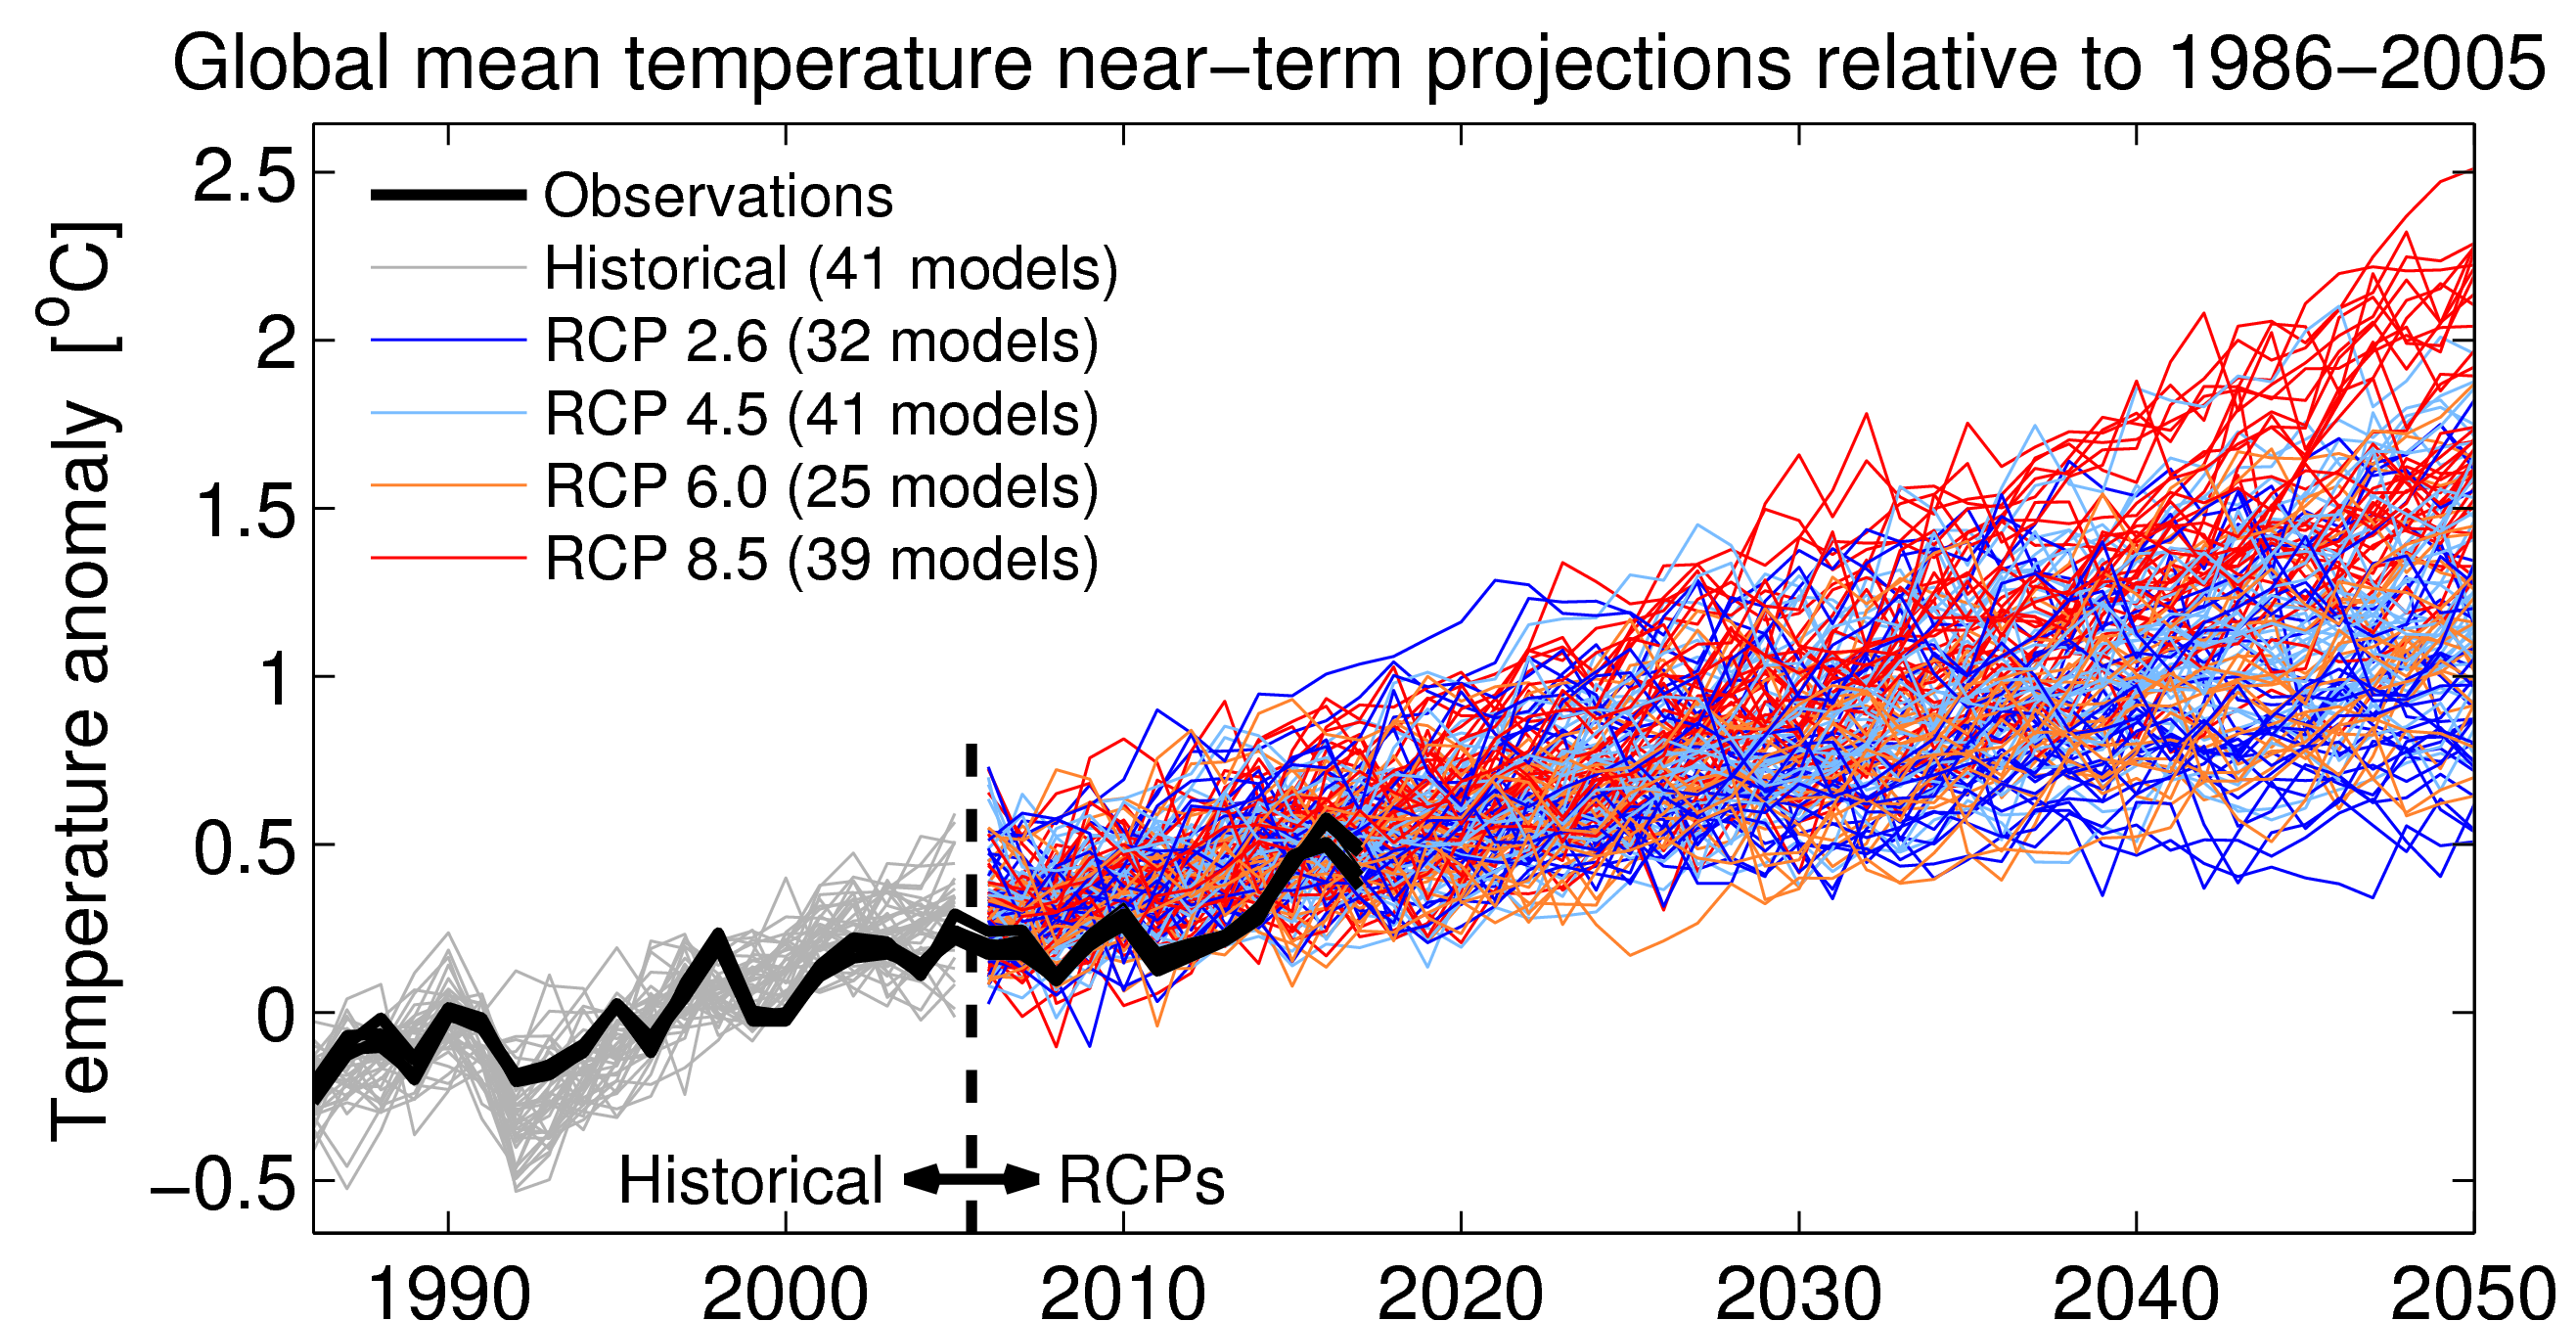
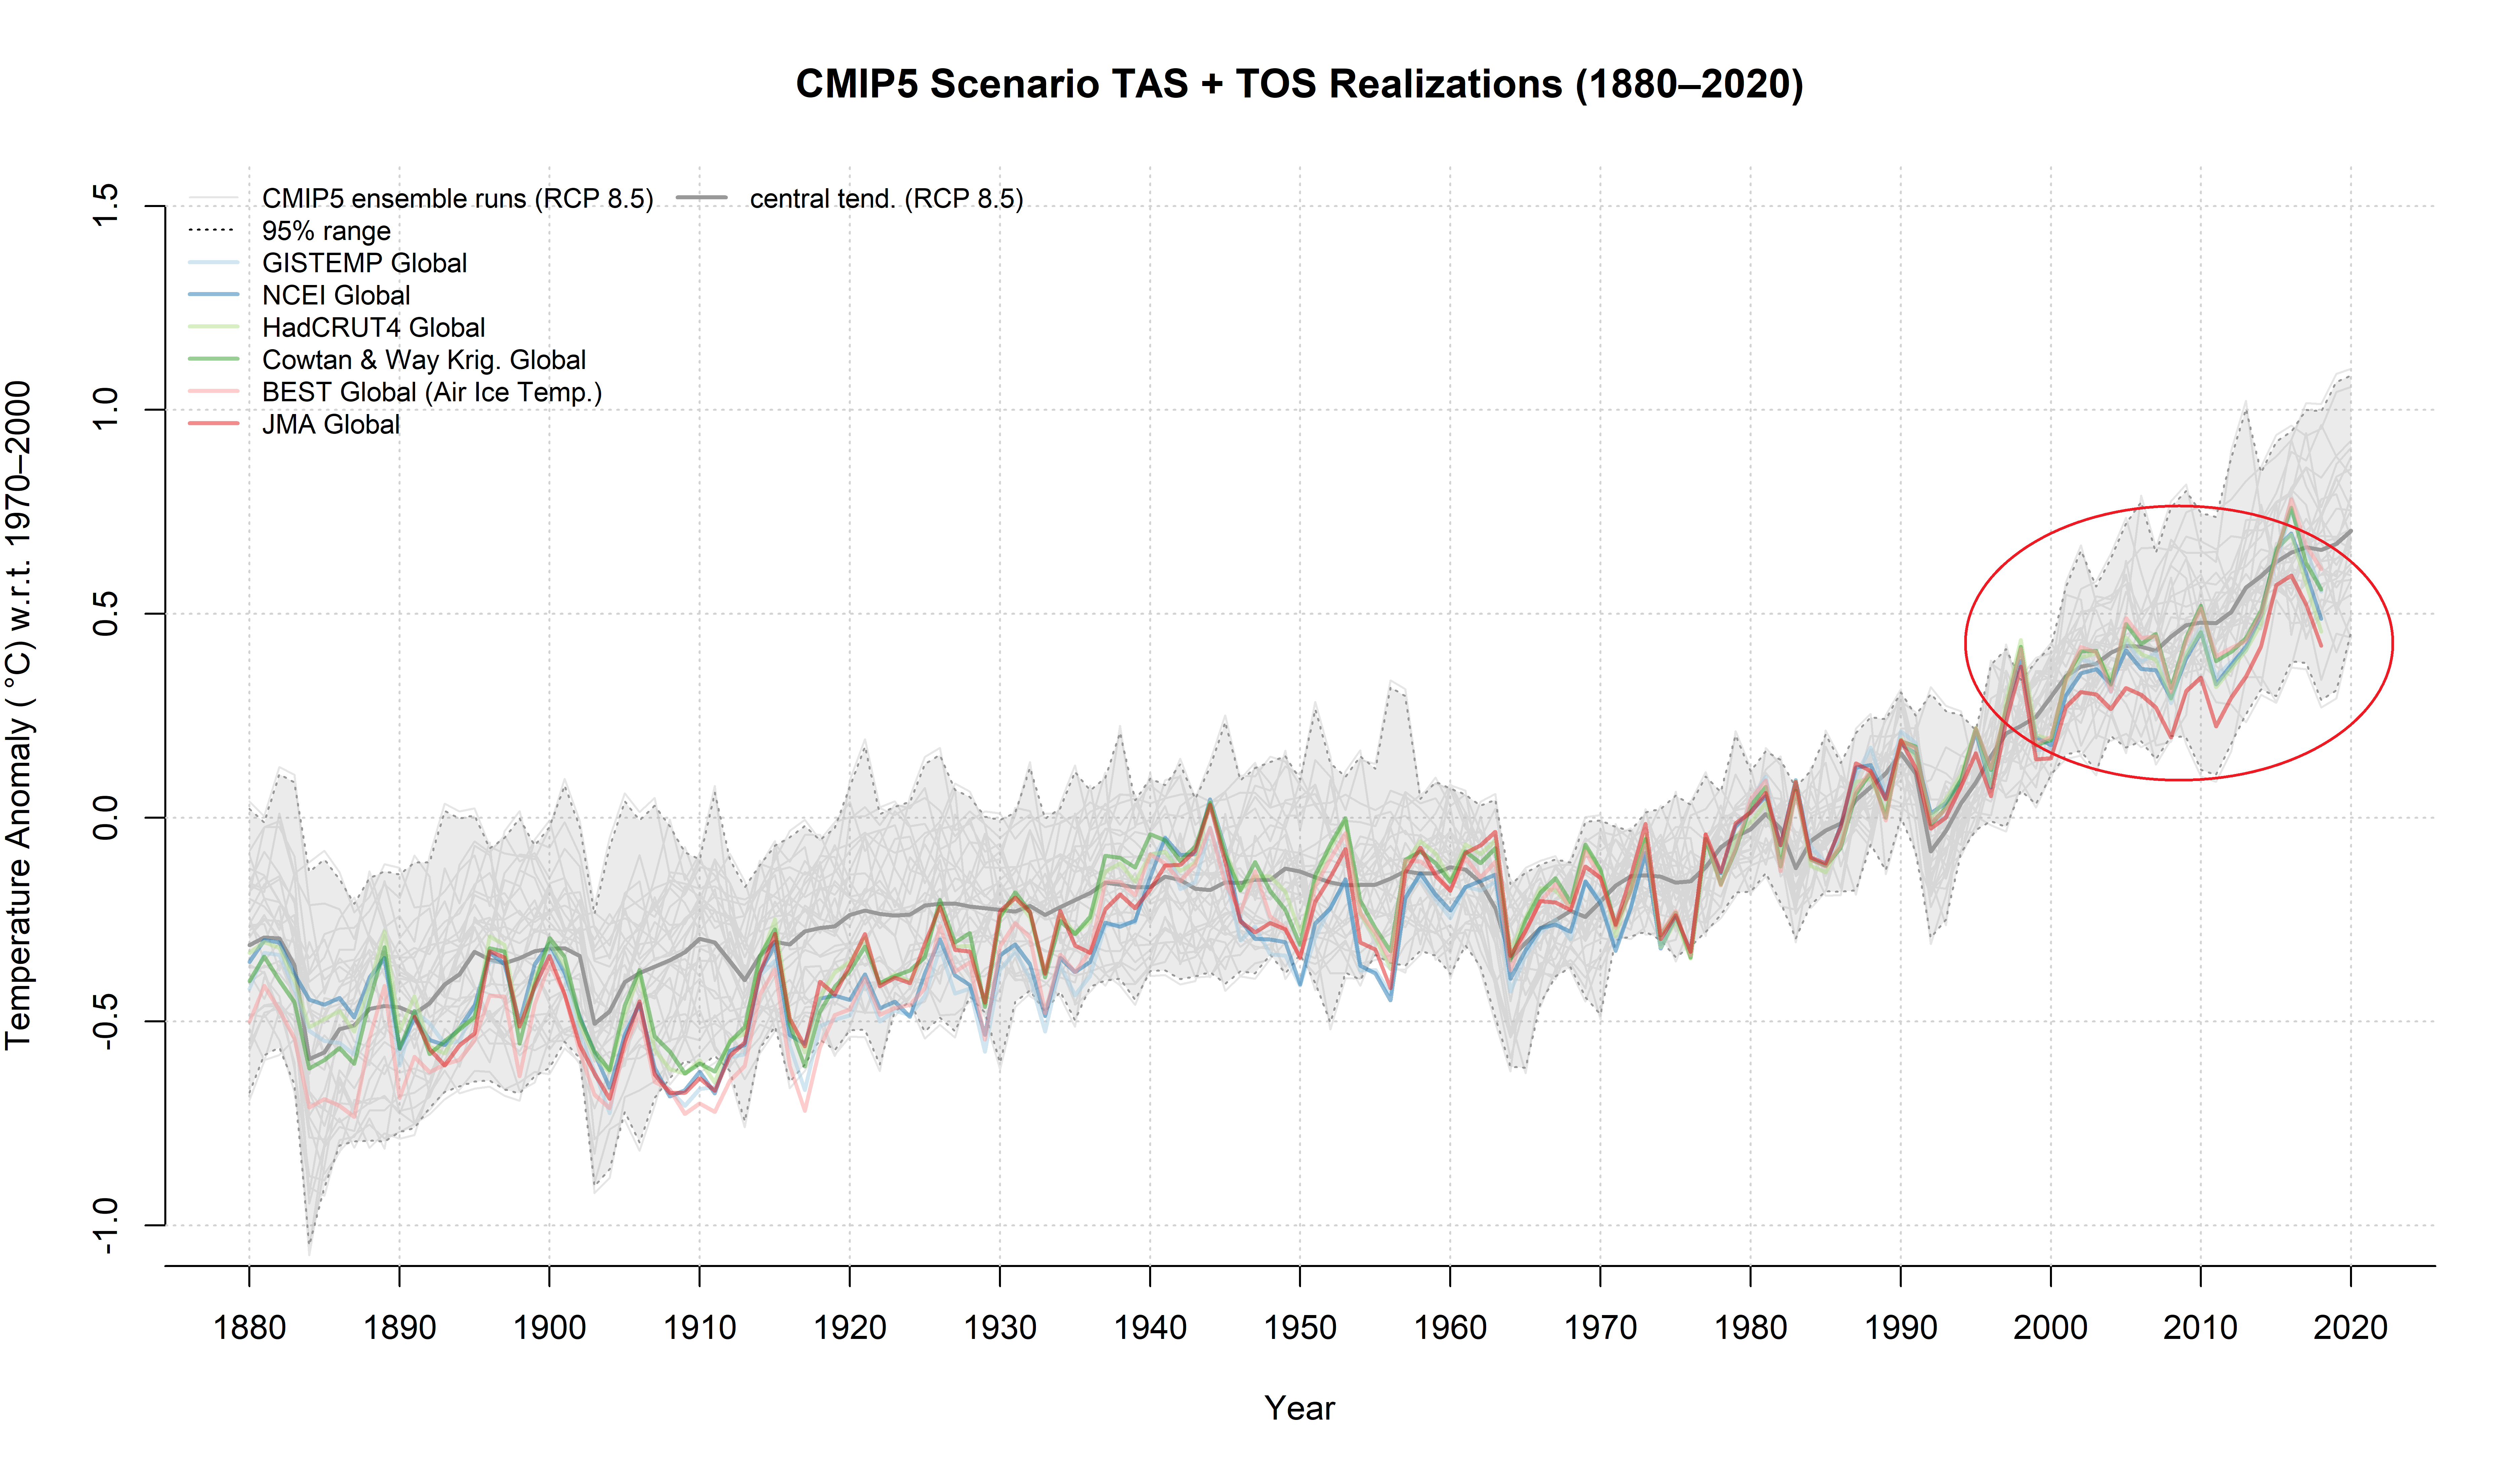
NOAA’s graphs show\ temperature readings with observed temperatures increasing by 0.5 degrees Celsius which would translate to 16.9 degrees Fahrenheit. Noted a temperature anomaly of two degrees Celsius would cause devastation and the NOAA conclusions would be accurate. Here is my graph with mined data directly from NOAA from seven stations across the Continental United States.
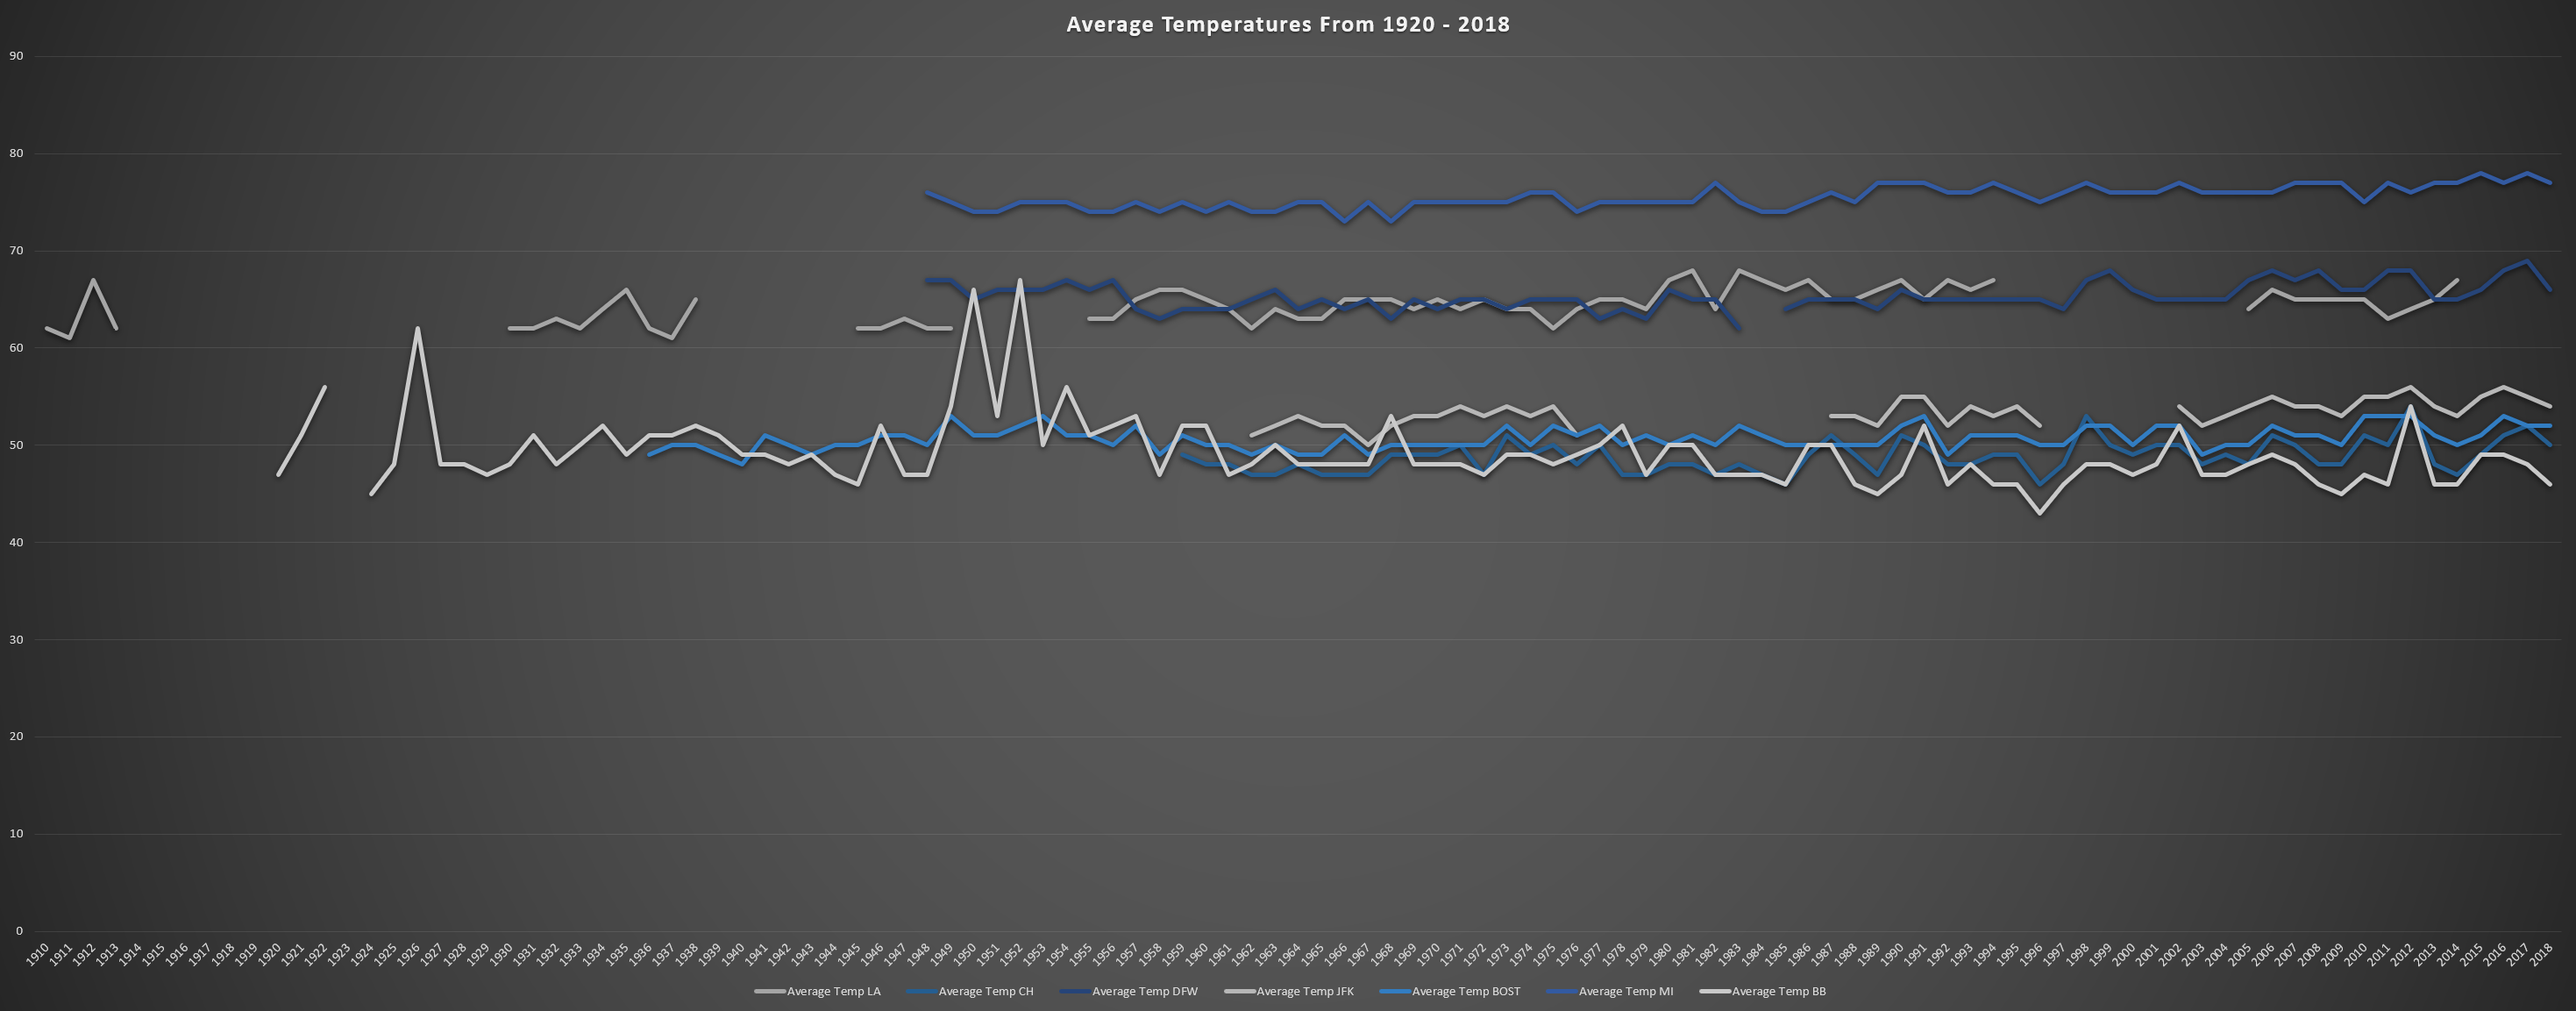
Here are the predictions and a table with my findings:
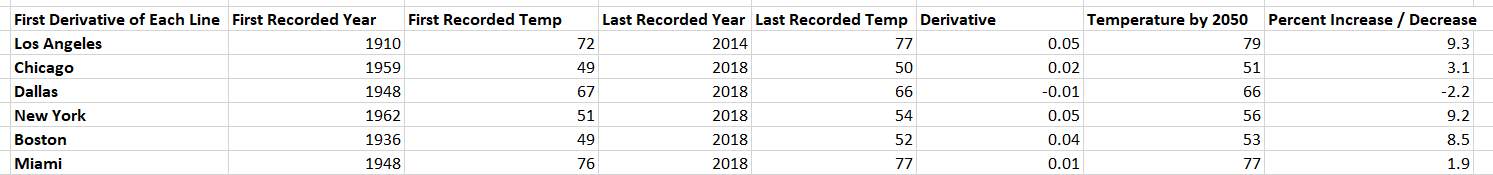
The readings in NOAA’s first graph were observations and predictions of temperature rise from 2005 to 2050. My mining parsing program finds a temperature anomaly to be in the range of 0.05 degrees to 0.01 degrees. Why is this? This begs the question, where am I or where is this government organization wrong? Below is a link to download my mining application and its source.
http://macdaddy4sure.com/Downloads/NOAA_Data_Miner.zip
Filed under: Uncategorized - @ June 3, 2023 5:38 pm